The Real Rulers of the World Have Ticker Symbols
Introducing The TSC State Capitalism Index
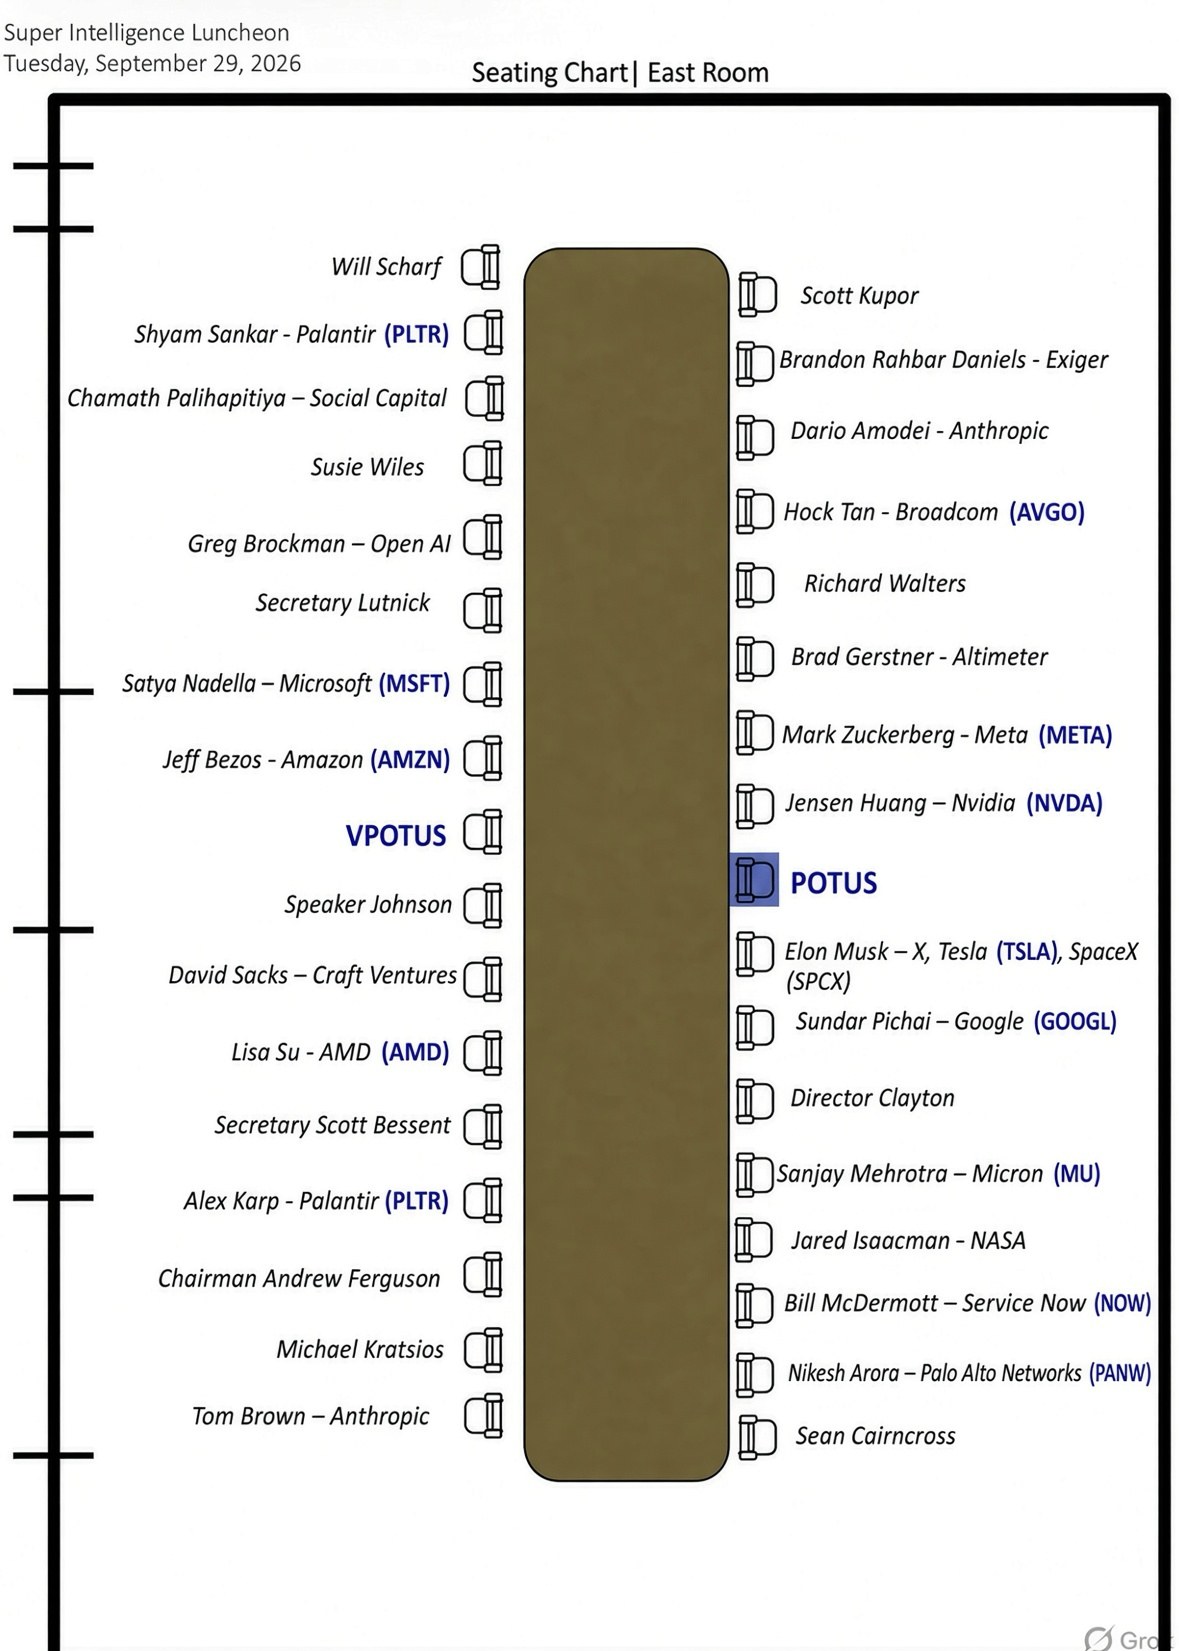
On September 29 the White House hosted a “Super Intelligence Luncheon” in the East Room, and the guests signed the White House Accord on “Super Intelligence”. (Yes, the one that spelled it “Unites States”.)
Within hours, the seating chart was everywhere. It got passed around under a dozen different captions, but most of them said some version of the same thing: this is a diagram of the people who actually run the world.
I had Grok annotate it with the ticker symbol of every publicly traded company at the table. Here is what came back.
Count the chairs
If we start at the President’s elbow and work your way around the table and you get a roster that reads like the headlines of AI-capex earnings season:
NVDA, META, AVGO, PLTR, MSFT, AMZN, AMD, PLTR (again), PANW, NOW, MU, GOOGL, and TSLA / SPCX.
Thirteen tickers across fourteen chairs. Two details worth noting: Palantir has two seats at the table: Alex Karp and Shyam Sankar. And Elon Musk’s one chair covers two listed companies, Tesla and the newly public SpaceX.
Everyone else in the room is cabinet, staff, regulators, venture capitalists, or the private AI labs, none of which you can buy on a stock exchange (yet).
Why this is symbolic of our State Capitalism thesis:
Our framework at The Sovereign Capitalist, with the Post Singularity Stack, is that we organize the investment universe through one big barbell trade: State Capitalism on one end and Freedom Tech on the other.
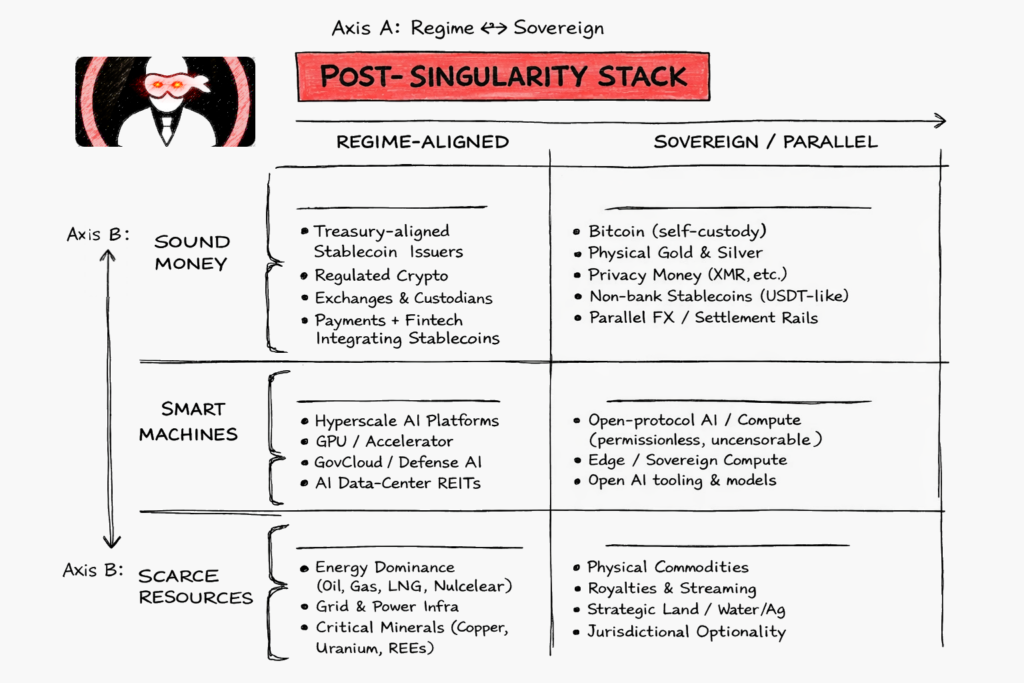
We published our State Capitalism thesis in the January ’26 edition of the letter, and put out a public version here.
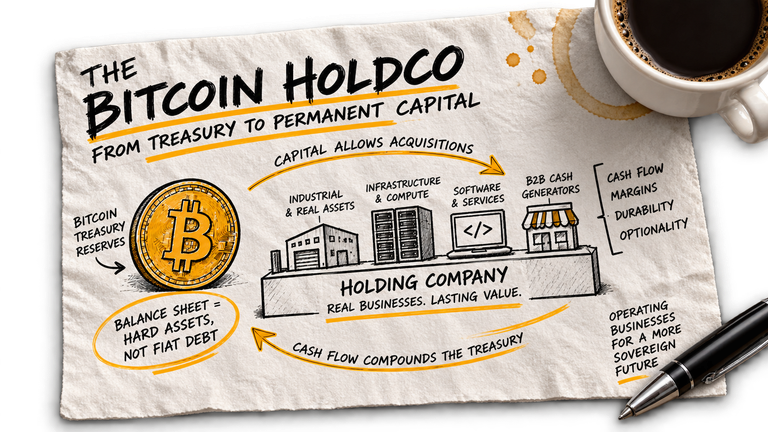
State Capitalism is the Western analog of China’s “socialism with Chinese characteristics” and is the set of companies that have become, in effect, partners of the state: the firms that build its compute, its surveillance and defence software, its chips, its cloud and its launch capacity, and that get a chair when the rules are being written.
You can feel however you like about that arrangement. The reality is that it exists, it is bipartisan in practice, it does not look like it is going away and most importantly investable.
The September 29th “Super Intelligence Summit”, a voluntary, self-policed accord co-signed over lunch is what it looks like when government and industry reduce the pretence of being separate. Did corporations capture the government? Did the government strong-arm the business sector? Does it matter?
What really matters is how does one allocate to this?
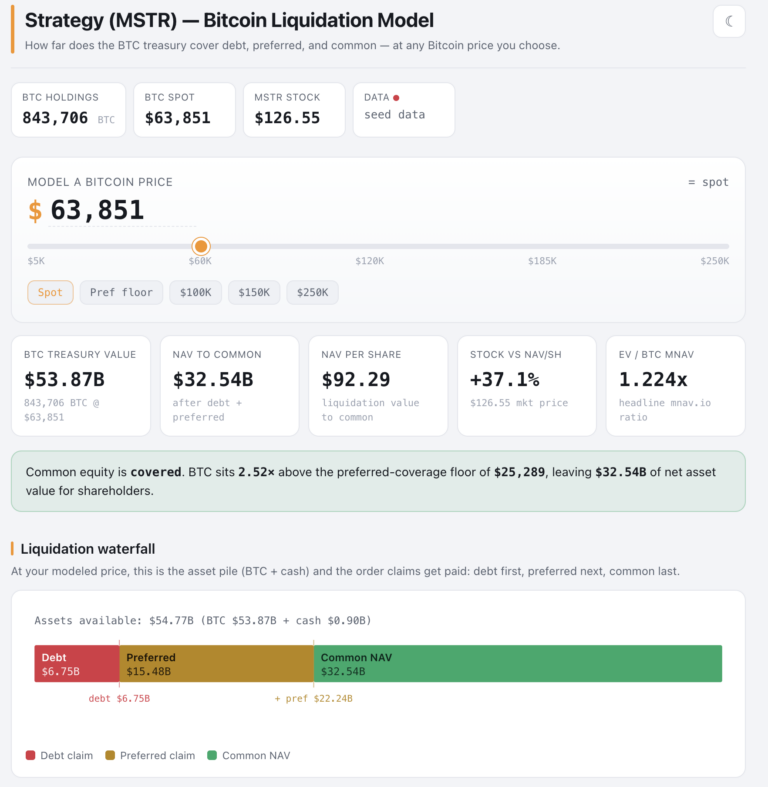
Which also raises a question worth putting real numbers against: is it better to lend the United States money, or to own the companies it now treats as partners?
Introducing The TSC State Capitalism IndexTM
So I turned the seating chart into an index. The official version is seat-weighted (one chair, one vote, so Palantir counts double and Tesla and SpaceX split Musk’s chair), buy-and-hold, with a base of 100 at the September 30 close. It goes live on October 1, 2026 and updates after every US market close.
In widget below you can change the weighting (equal weight, or my favourite, proximity to POTUS, where the closer you sat to the President the more your stock counts), drop any company by clicking its chair, rebalance quarterly, and race the basket against the S&P 500, the Nasdaq-100, gold, bitcoin, and a 10-year US Treasury held at constant maturity. That last one is the benchmark that matters: it is the return on lending money to the government whose table this was.
About that backtest
You can push the entry date back as far as January 2021, and the results (as of the September 30 close) are, frankly, absurd. Entered at Joe Biden’s inauguration, the seat-weighted basket is up more than 550% while the 10-year Treasury lost money in total-return terms. Entered at Donald Trump’s second inauguration, it is up roughly 160% against about 30% for the S&P 500 and low single digits for the Treasury.
Do not take those numbers at face value. The backtest is rigged by construction: these are the companies that got invited because they already won. Survivorship bias is baked in, which is exactly why the shaded area on the chart is labelled “backtest” and the real experiment starts on October 1. From here on, nobody gets to pick the winners with hindsight.
My bet
I am not suggesting anybody run out and buy all thirteen of these. For the record, the TSC model portfolio already owns three of them (PLTR, MU and TSLA), and I hold AMZN personally, outside the official roster.
But I will put a stake in the ground. Over the coming months and years, regardless of who occupies the White House, I expect the State Capitalism Index to outperform both the broad market and the Treasury it is being measured against. The widget will keep score in public, every trading day. Check back.
Prices are end-of-day adjusted closes (dividends and splits included). The index and its benchmarks are for information and entertainment only and are not investment advice.